

What Is Technical Analysis for Crypto Trading?

As a crypto trader, you know that technical analysis is essential for maneuvering the volatile crypto market. By examining historical price data, chart patterns, and technical indicators, you can identify emerging trends and make informed trading decisions. Technical analysis allows you to develop effective strategies, such as trend following and algorithmic trading, which consider market microstructure and order book dynamics. Leveraging this powerful tool can vastly improve your trading performance, but there’s more to explore beyond the basic indicators…
Key Takeaways
Key points on technical analysis for crypto trading:
- Technical analysis in crypto trading enables understanding and prediction of price movements through examination of historical market data.
- Key technical indicators like Ichimoku Cloud, VWAP, and Aroon help traders identify trends, confirm reversals, and anticipate price movements.
- Strategies like trend following, algorithmic trading, and order flow analysis leverage technical indicators to enhance trading performance in volatile crypto markets.
- Advanced indicators like RSI, MACD, and head and shoulders patterns provide additional insights into momentum, market direction, and potential price reversals.
- Incorporating order flow and market microstructure analysis strengthens trading strategies by revealing hidden trading pressures and supply/demand dynamics in the crypto space.
The Significance of Technical Analysis in Crypto Trading
Technical analysis is an essential tool for cryptocurrency traders. It enables you to understand and predict price movements in the volatile crypto market. By examining historical market data, including price action, chart patterns, and various technical indicators, you can identify emerging trends and make informed trading decisions. This is vital in the cryptocurrency space, where market conditions can shift rapidly. Technical analysis equips you with the skills to navigate these fluctuations, develop effective trading strategies, and capitalize on opportunities across different crypto assets. Whether you’re a beginner or an experienced trader, incorporating technical analysis into your approach can greatly enhance your understanding of the market and improve your trading performance.
Key Technical Indicators for Crypto Traders
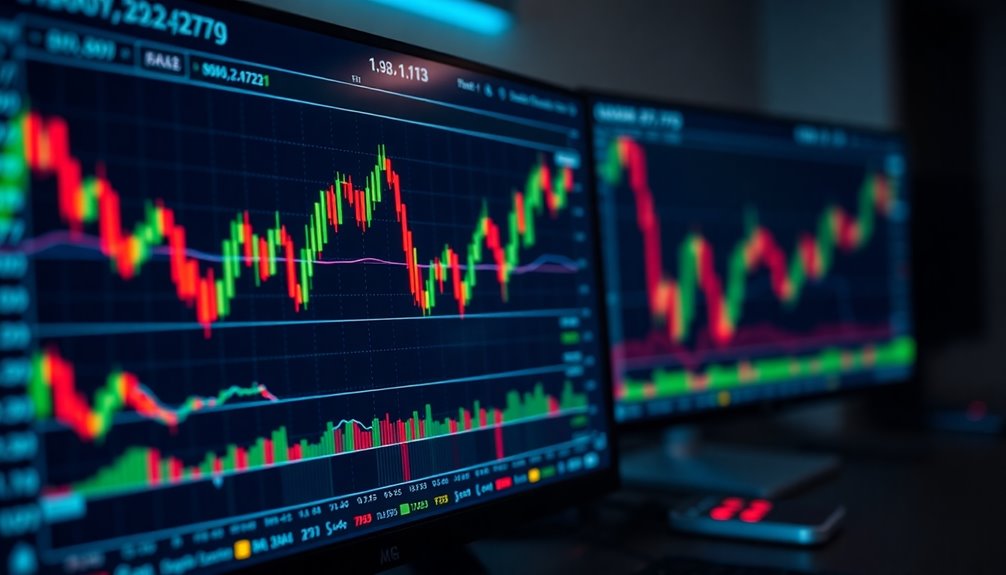
When it comes to trading cryptocurrencies, you can’t afford to overlook the power of key technical indicators. Ichimoku Cloud, for instance, combines moving averages and price action to signal bullish and bearish trends. Volume Weighted Average Price (VWAP) considers both price and volume to calculate the average trading price, indicating buying or selling pressure. The Aroon indicator measures trend strength, helping confirm trends and identify potential reversals. Chaikin Money Flow analyzes order flow to anticipate price movements by revealing hidden trading pressures. Finally, Average True Range (ATR) measures volatility, essential for understanding crypto market behavior and managing risk. Mastering these technical analysis tools can greatly enhance your crypto trading strategy.
Applying Technical Analysis Strategies in Crypto Markets
Applying technical analysis strategies in the volatile crypto markets can provide traders with a valuable edge. Trend following, algorithmic trading, breakout trading, and order flow analysis all leverage advanced tools and techniques to navigate the unique dynamics of cryptocurrencies. By understanding market microstructure and key indicators like moving averages, Bollinger Bands, and trading volume, traders can identify emerging trends and potential breakouts early, maximizing profit opportunities. The table below outlines how these strategies can be applied to enhance crypto trading performance.
| Strategy | Focus | Key Indicators |
|---|---|---|
| Trend Following | Capturing early trends | Adaptive moving averages |
| Algorithmic Trading | Automated execution | Predefined rules/signals |
| Breakout Trading | Identifying breakouts | Bollinger Bands, volume |
| Order Flow Analysis | Hidden market forces | Order book data, volume |
| Market Microstructure | System dynamics | Participants, regulations |

Advancing Beyond Basic Technical Indicators
While the foundational technical indicators like moving averages and Bollinger Bands can provide valuable insights, traders who wish to advance their crypto trading strategies should consider incorporating more sophisticated analytical tools. Relative Strength Index (RSI), for example, is an oscillator that measures the momentum of a crypto asset, offering signals about overbought or oversold conditions. Trend-following indicators like Average Convergence Divergence (MACD) can shed light on the overall market direction, while Head and Shoulders patterns can uncover potential reversals. Analyzing order book depth and order flow data can also reveal hidden trading pressures that influence price movements, enhancing understanding of supply and demand dynamics.
Incorporating Order Flow and Market Microstructure Analysis
To advance your crypto trading strategies beyond basic technical indicators, you should incorporate order flow analysis and an understanding of market microstructure. By examining real-time trade data, you can anticipate potential price movements. Analyzing the order book depth and liquidity provides insights into hidden trading pressures that influence cryptocurrency prices. Understanding the unique microstructure of crypto markets, including participant rules and execution systems, enhances your interpretation of price actions. Incorporating these techniques alongside traditional technical indicators can strengthen your trading strategies in the volatile crypto space. Evaluating the interplay between order dynamics and market structure is essential for making informed trading decisions.
| Order Flow Analysis | Order Book Depth | Liquidity | Market Microstructure |
|---|---|---|---|
| Examines real-time trade data | Provides insights into trading pressures | Influences cryptocurrency prices | Enhances interpretation of price actions |
| Anticipates potential price movements | – | – | – |
| – | – | – | Participant rules and execution systems |
| – | – | – | Improves trading strategies |
Frequently Asked Questions
How to Use Technical Analysis in Crypto Trading?
To effectively use technical analysis in crypto trading, start by identifying key price patterns, support/resistance levels, and momentum indicators. Employ moving averages, relative strength index (RSI), and Bollinger Bands to assess market trends and volatility. Combine this with trading volume analysis to confirm signals. Apply risk management strategies, and backtesting to validate your approach. Continuously refine your analysis as the crypto market evolves, staying adaptable to capitalize on opportunities.
Is Technical Analysis Enough for Crypto Trading?
No, technical analysis alone is likely insufficient for successful crypto trading. The cryptocurrency market’s high volatility and unique dynamics mean fundamental factors like a project’s team, utility, and adoption often play a significant role in long-term valuation. Additionally, external influences like news, regulations, and global economics can impact crypto prices in ways technical analysis may not capture. Combining technical and fundamental analysis provides a more thorough approach to traversing the volatile crypto markets.
What Is the Best Crypto Chart for Technical Analysis?
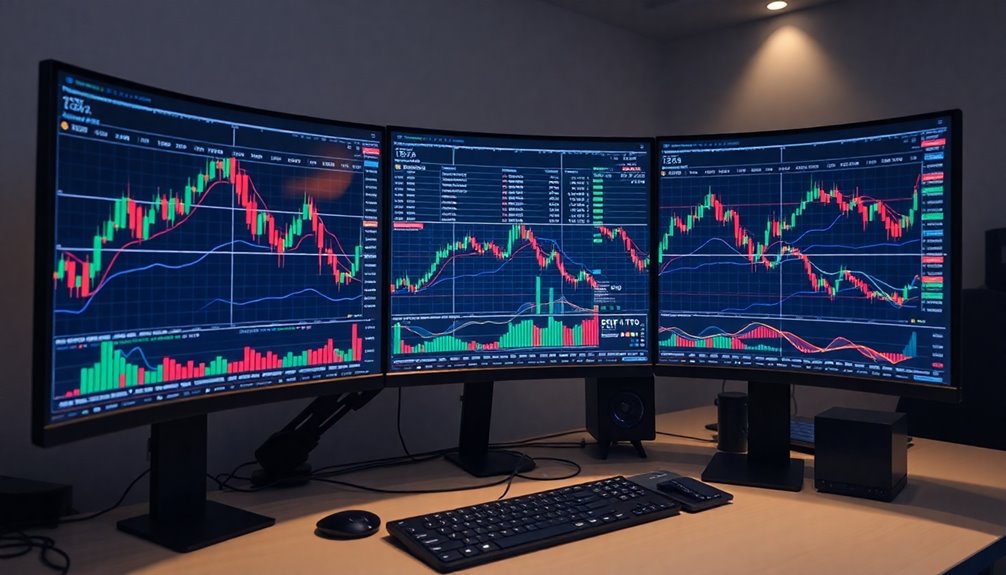
When it comes to technical analysis for crypto trading, the old adage ‘a picture is worth a thousand words’ rings true. Japanese candlestick charts are widely considered the best option, as they provide the most inclusive visual representation of price action, clearly depicting the relationship between opening, closing, high, and low prices. Overlaying volume charts can further enhance insights into market sentiment and trading activity. Ultimately, a multi-timeframe approach utilizing different chart types can offer a more thorough view of the crypto market’s behavior.
What Is the Best Technical Indicator for Crypto?
The best technical indicator for crypto depends on your trading goals and strategy. While indicators like RSI, Ichimoku, VWAP, Aroon, and MACD can provide valuable insights, there’s no single “best” option. Consider experimenting with different indicators, evaluating their performance in your trading approach, and combining multiple indicators to enhance your analysis. Ultimately, the most effective technical indicator will be the one that aligns with your unique trading objectives and risk tolerance.